What Is STILT?#
Suppose a tower in Salt Lake City measures a methane spike at 2 pm. Where did that methane come from? A landfill to the south, a refinery to the north, or the valley’s gas pipes? STILT answers that by working backward from the measurement. It follows the air that arrived at the tower back in time, and records where that air was close enough to the ground to pick up emissions.
Atmospheric scientists use STILT (Stochastic Time-Inverted Lagrangian Transport) to link trace-gas measurements from towers, aircraft, vehicles, and satellites to the surface areas that influenced them. PYSTILT is a Python version of STILT.
How STILT works, in three steps#
Say where and when you measured. STILT calls this location and time a receptor. It can be a single point (a tower inlet), a vertical column (a ground-based spectrometer), or a set of points along a slanted line of sight (a satellite sounding).
Release particles and run them backward. STILT releases a cloud of imaginary air parcels, called particles, at the receptor and moves them backward in time using gridded wind fields from a weather model (the meteorology). Each particle also gets random turbulent motion, so the cloud spreads out the way real air mixes. The particle paths are the trajectories.
Turn the particle paths into a footprint. Wherever particles spend time near the ground, the surface there can influence the measurement. STILT counts this up on a map grid. The result is a footprint, and each grid cell’s value says how much a unit of emissions there would change the measurement.
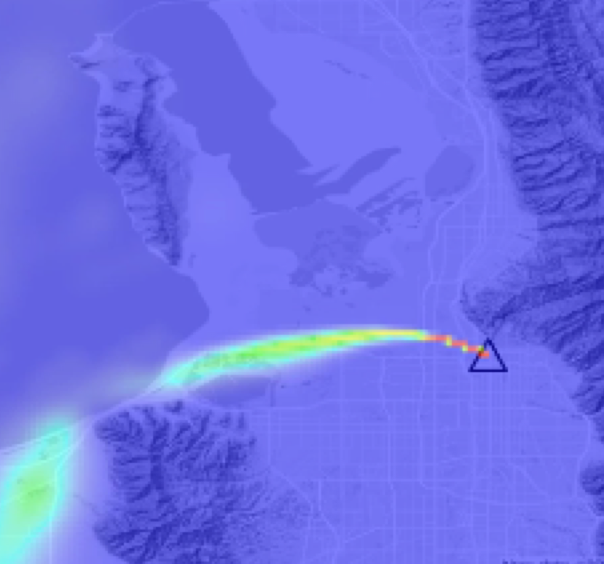
A footprint for a receptor over Salt Lake City. Warm colors mark the areas that most strongly influenced the measurement.#
What you can do with a footprint#
Multiply a footprint by an emissions map (a flux inventory) and add it up, and you get the concentration increase your receptor should have seen. Do that for many measurements and compare with what was actually observed, and you can test an inventory or estimate emissions in an inversion. The Tutorial: From Footprints To Concentrations tutorial covers the first step, turning footprints into modeled concentrations.
What you need#
Python 3.10 or newer, and PYSTILT (Installation).
Meteorology in ARL format. STILT needs gridded winds, temperature, and turbulence fields from a weather model such as HRRR, NAM, or GDAS, in the format used by NOAA’s Air Resources Laboratory (ARL). Many research groups keep an archive of these files. If you don’t have one, PYSTILT can download them from NOAA for you (see Meteorology).
The times and locations of your measurements.
You do not need to install HYSPLIT, the Fortran program STILT uses to move particles. PYSTILT includes it for Linux and macOS (Intel).
Why PYSTILT?#
PYSTILT gives the same footprints as STILT-R, checked cell by cell. It also makes a few things easier.
You work in Python only. There is no R to install, and results load straight into pandas and xarray.
Settings are checked before anything runs, so most typos in
config.yamlare reported at once instead of an hour into a cluster job.Reruns pick up where they left off. PYSTILT runs only the simulations whose outputs are missing.
The same project runs on your computer or on a Slurm cluster. Switching takes a few lines of configuration.
Column and slanted receptors, averaging kernels, and pressure weighting are built in for column and satellite measurements.
Trajectories are saved as Parquet files and footprints as NetCDF.
Where PYSTILT comes from#
PYSTILT builds on a line of open-source transport models:
Model |
What it is |
Reference / link |
|---|---|---|
HYSPLIT |
NOAA ARL’s particle transport model. PYSTILT runs HYSPLIT to move the particles. |
|
STILT |
Adds improved boundary-layer mixing, near-field dilution corrections, and footprint calculation on top of HYSPLIT. |
|
STILT-R v2 |
The R version of STILT. PYSTILT’s project layout and settings follow it closely. |
|
X-STILT |
STILT-R extensions for column and satellite measurements, including averaging kernels and transport-error analysis. |
|
stiltctl |
Tools for running large STILT workloads in the cloud. |
If you use STILT in published work, please cite Lin et al. (2003) and Fasoli et al. (2018), plus Wu et al. (2018) for column work, and PYSTILT itself through its Zenodo DOI.
Next: Installation.