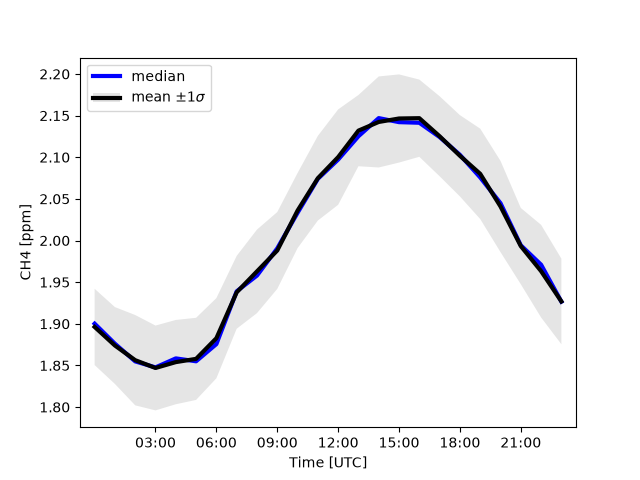
lair.plotter.diurnalPlot#
- lair.plotter.diurnalPlot(data, param, stats=None, units=None, tz='UTC', freq='1h', ax=None, colors=None, min_count=0)[source]#
Plot the diurnal cycle of data.
- Parameters:
data (pd.DataFrame) – Data to plot.
param (str) – Parameter to plot.
stats (str | list[str], optional) – Statistics to plot. Defaults to [‘std’, ‘median’, ‘mean’].
units (str | None, optional) – Units of the parameter for the ylabel. Defaults to None.
tz (str, optional) –
Timezone of the data. Defaults to ‘UTC’.
Warning
DOES NOT CONVERT TIMEZONES.
freq (str, optional) – Frequency of the data. Defaults to ‘1h’.
ax (plt.Axes | None, optional) – Axis to plot on. Defaults to None.
colors (str | dict[str, str], optional) – Colors of the statistics, or a single color for all of them. Defaults to {‘mean’: ‘black’, ‘median’: ‘blue’, ‘std’: ‘gray’}.
min_count (int, optional) – Minimum count to plot. Defaults to 0.
- Returns:
plt.Axes – Axis with the plot
- Return type:
See also
seasonalPlotThe cycle over the year.
lair.clock.diurnalThe cycle it plots, as numbers.
Examples
>>> import numpy as np
>>> import pandas as pd
>>> from lair.plotter import diurnalPlot
>>> rng = np.random.default_rng(0)
>>> time = pd.date_range("2024-01-01", periods=24 * 90, freq="1h")
>>> cycle = 0.15 * np.cos(2 * np.pi * (time.hour.to_numpy() - 15) / 24)
>>> data = pd.DataFrame(
...     {"CH4": 2.0 + cycle + rng.normal(0, 0.05, len(time))}, index=time
... )
>>> ax = diurnalPlot(data, "CH4", units="ppm")