lair.plotter.polarFreq#
- lair.plotter.polarFreq(data, x='ws', wd='wd', xbins=30, scale_angle=None)[source]#
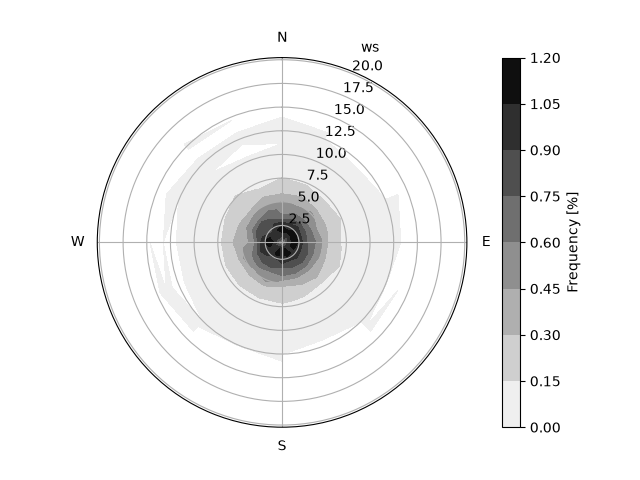
Plot the contoured frequency of the data.
The colorbar is the percent of all the samples that fall in each bin of direction and
x, so the bins add up to 100; empty bins are blank.- Parameters:
data (pd.DataFrame) – Data to plot.
x (str, optional) – Variable to bin in the radial axis. Defaults to ‘ws’.
wd (str, optional) – Variable to bin in the angular axis. Defaults to ‘wd’.
xbins (int, optional) – Number of bin edges in the radial axis (
xbins - 1bins), or explicit edges; seelair.air.bin_polar(). Defaults to 30.scale_angle (float | None, optional) – Angle to position the radial axis label. Defaults to None.
- Returns:
plt.Axes – Axis with the plot
- Return type:
See also
lair.air.bin_polarBins the data by wind direction and speed.
polarPlotA statistic of a variable (its mean, say) in each bin, not the count.
create_polar_axThe axis it draws on.
Examples
>>> import numpy as np
>>> import pandas as pd
>>> from lair.plotter import polarFreq
>>> rng = np.random.default_rng(0)
>>> n = 20000
>>> data = pd.DataFrame(
...     {
...         "ws": rng.gamma(2.0, 1.5, n),  # wind speed [m/s]
...         "wd": rng.uniform(0, 360, n),  # wind direction [degrees]
...     }
... )
>>> data["CH4"] = (
...     2.0
...     + 0.03 * data["ws"] * (1 + np.cos(np.radians(data["wd"] - 90)))
...     + rng.normal(0, 0.02, n)
... )
>>> ax = polarFreq(data)