lair.plotter.seasonalPlot#
- lair.plotter.seasonalPlot(data, param='CH4', units='ppm', ax=None)[source]#
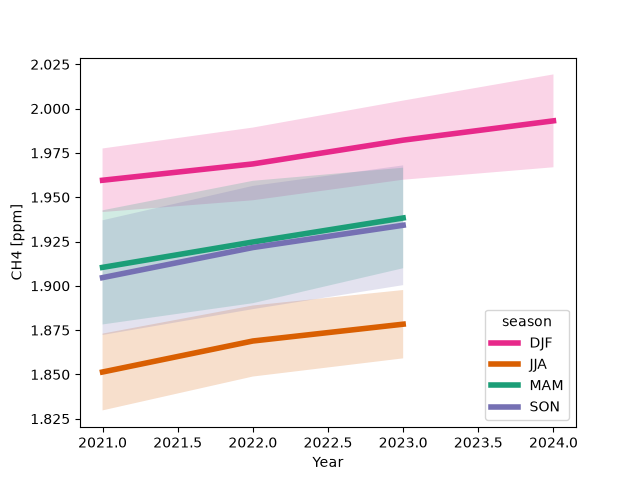
Plot the seasonal cycle of data by year.
Each season is one line, with a +/- 1 std band, plotted against its season-year from
lair.clock.seasonal(). DJF is labeled (and placed on the x axis) by its January/February year, so DJF 2024 (Dec 2023 - Feb 2024) sits at x = 2024. Partial seasons at the edges of the data are plotted.- Parameters:
- Returns:
plt.Axes – Axis with the plot
- Return type:
See also
diurnalPlotThe cycle over the day.
lair.clock.seasonalThe seasons it plots, as numbers.
Examples
>>> import numpy as np
>>> import pandas as pd
>>> from lair.plotter import seasonalPlot
>>> rng = np.random.default_rng(0)
>>> time = pd.date_range("2021-01-01", "2023-12-31", freq="1D")
>>> trend = 1.9 + 0.00004 * np.arange(len(time))
>>> annual = 0.06 * np.cos(
...     2 * np.pi * (time.day_of_year.to_numpy() - 20) / 365.25
... )
>>> data = pd.DataFrame(
...     {"CH4": trend + annual + rng.normal(0, 0.02, len(time))}, index=time
... )
>>> ax = seasonalPlot(data)