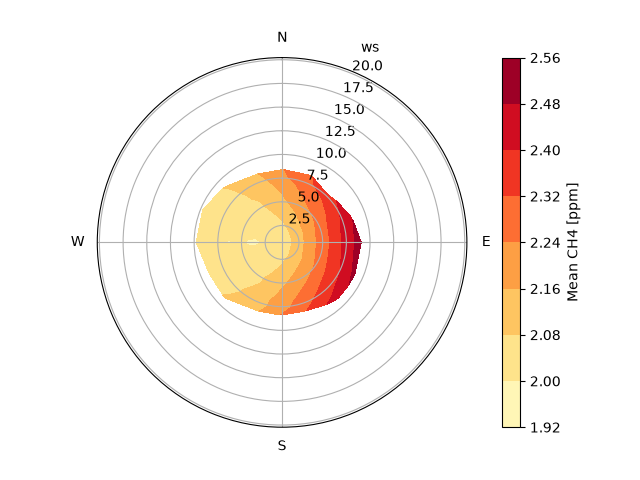
lair.plotter.polarPlot#
- lair.plotter.polarPlot(data, param='CH4', x='ws', wd='wd', statistic='mean', units='ppm', min_bin=1, xbins=30, scale_angle=None)[source]#
Plot polar contour of data.
- Parameters:
data (pd.DataFrame) – Data to plot.
param (str, optional) – Parameter to plot. Defaults to ‘CH4’.
x (str, optional) – Variable to bin in the radial axis. Defaults to ‘ws’.
wd (str, optional) – Variable to bin in the angular axis. Defaults to ‘wd’.
statistic (str, optional) – Statistic to plot. Defaults to ‘mean’.
units (str, optional) – Units of the parameter for the colorbar label. Defaults to ‘ppm’.
min_bin (int, optional) – Minimum count in each bin to plot. Defaults to 1.
xbins (int, optional) – Number of bin edges in the radial axis (
xbins - 1bins), or explicit edges; seelair.air.bin_polar(). Defaults to 30.scale_angle (float | None, optional) – Angle to position the radial axis label. Defaults to None.
- Returns:
plt.Axes – Axis with the plot
- Return type:
See also
lair.air.bin_polarBins the data by wind direction and speed.
polarFreqHow often the winds fall in each bin, not a value by wind.
create_polar_axThe axis it draws on.
Examples
>>> import numpy as np
>>> import pandas as pd
>>> from lair.plotter import polarPlot
>>> rng = np.random.default_rng(0)
>>> n = 20000
>>> data = pd.DataFrame(
...     {
...         "ws": rng.gamma(2.0, 1.5, n),  # wind speed [m/s]
...         "wd": rng.uniform(0, 360, n),  # wind direction [degrees]
...     }
... )
>>> data["CH4"] = (
...     2.0
...     + 0.03 * data["ws"] * (1 + np.cos(np.radians(data["wd"] - 90)))
...     + rng.normal(0, 0.02, n)
... )
>>> ax = polarPlot(data, min_bin=10)