lair.plotter.windvectorPlot#
- lair.plotter.windvectorPlot(data, wd='WD', ws='WS', ax=None, unit_length=False, **kwargs)[source]#
Plot wind vectors.
- Parameters:
data (pd.DataFrame) – Data to plot.
wd (str, optional) – Wind direction variable. Defaults to ‘WD’.
ws (str, optional) – Wind speed variable. Defaults to ‘WS’.
ax (plt.Axes | None, optional) – Axis to plot on. Defaults to None.
unit_length (bool, optional) – Normalize vectors to unit length. Defaults to False.
**kwargs – Additional arguments to pass to plt.quiver.
- Returns:
plt.Axes – Axis with the plot
- Return type:
See also
lair.air.wind_componentsThe u and v of a wind speed and direction.
polarPlotThe same wind data as a function of direction.
Examples
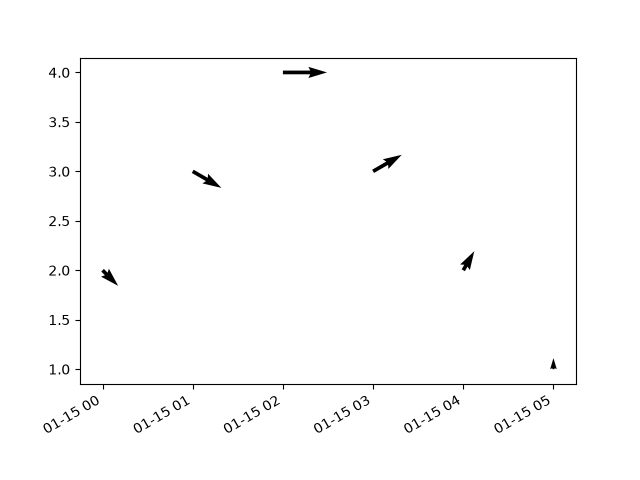
Winds turning from north-westerly to southerly over six hours, drawn at their speed:
>>> import pandas as pd
>>> from lair.plotter import windvectorPlot
>>> times = pd.date_range("2024-01-15 00:00", periods=6, freq="1h")
>>> winds = pd.DataFrame(
...     {"WD": [315, 300, 270, 240, 210, 180], "WS": [2, 3, 4, 3, 2, 1]},
...     index=times,
... )
>>> ax = windvectorPlot(winds)